Interactive data visualization in science and business practice
Lectures, discussions and workshops
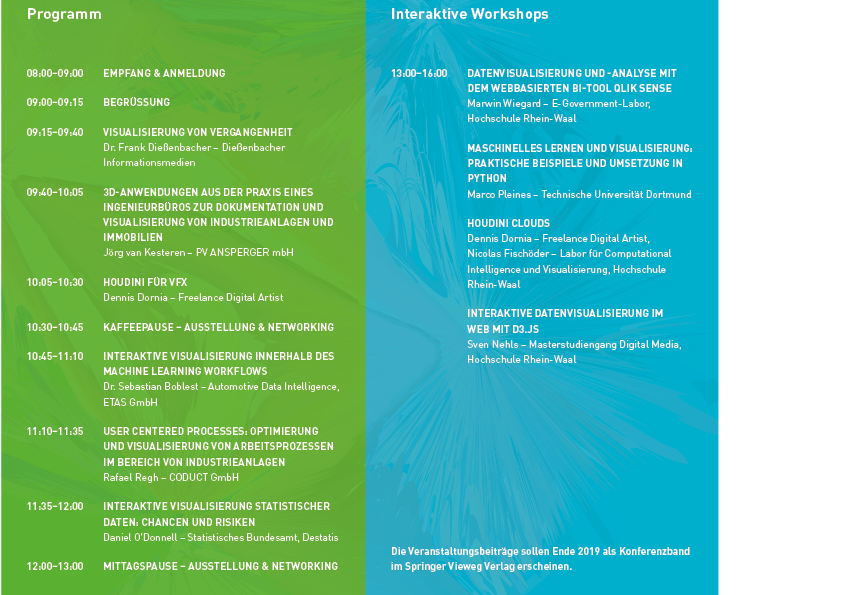
Interactive visualizations are increasingly important in science and practice. In addition to the analysis and presentation of company data, visualizations and animations using virtual and augmented reality technologies find their application in the planning of industrial plants, in architecture, in the representation of scientific processes or in the course of collaborative work.
Our VISUALIZE event focuses on this interdisciplinary field and offers numerous interesting lectures and practical workshops. Both the lectures in the morning and the workshops in the afternoon have been designed by renowned representatives from science and practice and offer the opportunity to develop creative visualisation ideas. Our workshops will introduce you to different visualization methods as well as the practical application of modern and useful tools in the areas of Business Intelligence (Qlik Sense), Machine Learning, Houdini and D3.js.
Practical users and students can expand their knowledge of methods while decision-makers can gain information on current trends, especially with regard to possibilities and limitations.
Participation is free of charge. For our interactive workshops in the afternoon a registration is necessary (Deadline: June 2, 2019), for the lecture part this is desired.
Registration and Infos
We look forward to your participation and an exciting exchange between science and practice.
Frank Zimmer, Professor of Computer Science and Mathematics
Timo Kahl, Professor of Business Informatics
Faculty of Communication and Environment, Rhein-Waal University of Applied Sciences
![]()
June 4, 2019 | Start 08:00 am
Rhine-Waal University
Kamp-Lintfort Campus
Friedrich-Heinrich-Allee 25
D-47475 Kamp-Lintfort